4 Visual KPI Tweaks That Prove ROI When Clients Stop Checking Reports
I remember the moment vividly. I had just finished a detailed client report—beautifully designed, data-rich, and packed with insights. But as I walked into the meeting, I saw the glazed expression on my client’s face. They weren’t looking at the report at all. They were more interested in their phone, distracted, disengaged. That’s when I realized: all those hours I spent crafting the perfect report might not be doing what I thought. It wasn’t just about data; it was about how that data was communicated—and whether it was truly resonating.
Why Your Reports Might Be Missing the Mark (And How to Fix It)
Is Your KPI Dashboard Just Too Much Noise?
Early in my career, I made the mistake of dumping every metric into a single dashboard, hoping more data would impress clients. Instead, I overwhelmed them. It was only later I discovered that cluttered visuals dilute the message and reduce ROI. According to a recent study, 73% of dashboards are underused because they fail to focus on the key metrics that matter most (source: Local SEO Report Pro). This was a wake-up call. Simplifying visuals and emphasizing actionable KPIs can drastically improve client understanding and satisfaction. I’ll share exactly how I turned my reports into compelling stories, not just data dumps. But first, I want to ask—have you ever felt your reports are falling flat, and clients are tuning out? If so, you’re not alone, and there’s a way to flip the script.
Streamline Your Metrics to Focus on What Matters
Start by trimming down your dashboards. Instead of overwhelming clients with every available metric, identify the core KPIs that directly impact their business goals. Use tools like KPI visualization strategies to craft clear, compelling visuals that highlight key insights. I once faced a client who was skeptical because they received a report with dozens of numbers. When I switched to a simple dashboard emphasizing three critical KPIs, their engagement soared, and the strategic decisions improved.
Create Engaging Visuals That Tell a Story
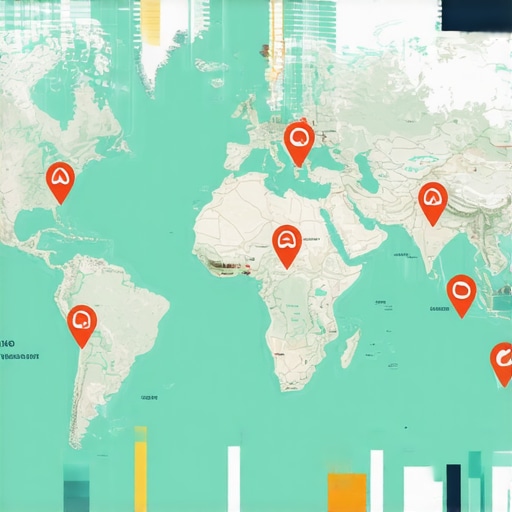
Transform raw data into visuals that resonate. Think of your graphs as a storybook—use color coding, annotations, and trend lines to guide eyes naturally through the narrative. For example, instead of static bar charts, incorporate visual storytelling techniques that illustrate progress over time. During a campaign, I used color-coded maps to demonstrate local rank improvements, which made the data instantly understandable even to non-technical stakeholders.
Leverage SEO Reporting Software Effectively
Use tools like SEO reporting software to automate data gathering and presentation. Set up automatic updates and custom dashboards tailored to each client’s KPIs. When I integrated my software to generate weekly reports, I noticed a significant reduction in client questions and increased trust, as they could see real-time progress without waiting for manual reports. Remember, automation isn’t just about saving time—it’s about delivering consistent, accurate insights effortlessly.
Connect Google Analytics Data with SEO Metrics
Maximize the value of Google Business Analytics by aligning its data with your SEO metrics. Track conversions, call volumes, and foot traffic alongside keyword rankings. I once combined GBA segments with local ranking data to reveal which search terms led to actual store visits, turning mundane reports into strategic goldmines. Use filters and segments to uncover hidden patterns—this step elevates your insights from superficial to actionable.
Simplify Maps Rank Tracking for Local Domination
Rely on maps rank tracking techniques that push beyond basic position reporting. Focus on map coverage, proximity shifts, and pin movements that influence local visibility. A mistake I often see is reporting only average map positions, which can be misleading. Instead, track changes within the local grid to identify potential optimization opportunities. Regularly verifying map data helps prevent clients from chasing phantom rankings, a common pitfall in local SEO.
Present Data in a Clear, Impactful Manner
Lastly, your visualization should prioritize clarity over complexity. Use concise charts, strategic annotations, and highlight actionable insights. Avoid data dumps; instead, craft narratives that support decision-making. For instance, a simple line graph showing a steady climb in local rankings, accompanied by a note on recent Google algorithm updates, can be more impactful than a detailed spreadsheet. Remember, your goal is to inspire confidence and clarity, ensuring clients see the true value of your SEO efforts.
Many professionals assume that simply tracking a broad array of metrics or relying heavily on automation guarantees SEO success. However, one of the most persistent misconceptions is that all data is equally valuable and that more information inherently leads to better decisions. In reality, focusing on superficial data points can cause you to overlook deeper, more actionable insights. For example, relying solely on average position metrics in maps rank tracking often masks the volatility of local rankings, leading to misguided optimizations. Advanced practitioners understand that nuances, like local grid shifts or proximity filters, can significantly distort typical reports if not properly accounted for, as discussed in this detailed analysis.
Another trap lies in overestimating the value of SEO reporting software without customizing its features to your specific needs. Many tools come with preset dashboards that look comprehensive but fail to highlight the crucial KPIs that directly impact client ROI. The danger is treating software as a one-size-fits-all solution rather than tailoring it to reveal the most impactful insights. Mastering KPI visualization strategies can help you craft reports that not only impress but also guide strategic actions.
When it comes to Google Business Analytics, a common mistake is neglecting the importance of integrating its data with other sources. Many overlook that combining call volumes, foot traffic, and conversion metrics with keyword rankings can uncover hidden opportunities and gaps. For instance, a spike in local searches may not translate into store visits if the analytics aren’t segmented properly, as explained in this post.
In terms of advanced mistakes, many experts underestimate the complexity of local pack shifts. Regularly, professionals report only the average rank position within a map grid, unaware that it can be skewed by temporary proximity filters or recent Google updates. This can lead to chasing phantom rankings, wasting resources on false positives. To avoid this, focus on the actual movements within the local grid, as highlighted in this comprehensive guide.
Ultimately, the key to genuine expertise lies in recognizing that data is rarely perfect and that understanding its hidden nuances can make or break your SEO efforts. Deep dives into the mechanics of ranking shifts, proper customization of reporting tools, and thoughtful integration of analytics sources are essential. Are you aware of how local grid fluctuations or data misinterpretations might be affecting your reports? If this rings true, let me know in the comments. Remember, mastering these subtle yet impactful details positions you as a true SEO strategist, not just an average practitioner.
Keep Your SEO Engine Running Smoothly with the Right Tools
Staying ahead in local SEO requires more than just choosing the right software; it demands consistent maintenance, strategic tweaks, and an understanding of evolving tech. I personally rely on SEO reporting software that offers automation, customization, and predictive insights—crucial for keeping data accurate and actionable over time. Regularly updating these tools ensures you’re capturing the latest ranking signals and avoiding pitfalls like outdated data or integration failures. For example, I’ve found that scheduling weekly data integrity checks prevents discrepancies in local maps rankings, saving me hours of troubleshooting.
How do I maintain SEO tools and reports over time?
It begins with routine audits. I set monthly review sessions to scrutinize data accuracy, verify rankings, and adjust KPIs as client goals change. Using integrated dashboards that consolidate data from Google Business Analytics alongside map rank tracking allows for a holistic view. This way, I can identify anomalies early—say, sudden drops in rankings that may result from algorithm updates or map grid shifts—and proactively address them. Remember, automation tools like maps rank tracking should be continually calibrated to reflect seasonal trends and local market shifts.
Enhance long-term results with strategic scaling
As your client base grows, scale your automation and visualization strategies accordingly. Implement advanced KPI visualization techniques to manage larger datasets smoothly. For instance, transitioning from simple line charts to interactive dashboards enables faster insights and better decision-making. The future of SEO automation hints at AI-driven analytics—so begin integrating intelligent reporting systems now, as described in this cornerstone guide. Test out these upgrades on a small scale, refine your processes, then expand progressively.
What’s next for long-term SEO success?
Stay alert to evolving tools and trends, such as the integration of AI with analytics—one expert source (like Google’s own technical documentation) points toward increasingly predictive and adaptive algorithms. proactively leveraging these innovations ensures your reports remain effective and your clients see tangible ROI. I recommend trying out automated KPI dashboards that adapt to client priorities in real time; this can significantly boost satisfaction and retention. For assistance or tailored strategies, visit our contact page to discuss your long-term SEO maintenance plan.
Continuously refining your tools and approaches isn’t just best practice—it’s the key that unlocks sustainable growth. Ready to take your SEO operations to the next level? Implement a routine data audit today and see the difference it makes in your results!

As I reflect on my journey through SEO insights,seo reporting software,google business analytics,maps rank tracking,kpi visualization, one lesson stands out: the most potent strategies often come from nuanced understanding rather than broad strokes. Early on, I believed that piling on metrics would impress clients—only to realize it muddied the message and dulled decision-making. The true power lies in tailored, specific insights that speak directly to a business’s core objectives. Recognizing the subtle signals in data, such as local grid shifts or API quirks, transformed my approach from reactive to proactive, proving that mastery demands both technical precision and strategic clarity.
What I’ve Learned Behind the Curtain of SEO Data Secrets
- The core of effective reporting isn’t the volume of data but the relevance and clarity of the insights you deliver. Cutting through superficial metrics to focus on actionable KPIs aligns your reports with what truly moves the needle for clients.
- Nuance matters in local rank tracking—small shifts in proximity can mislead averages, so a deep dive into local grid movements reveals opportunities others overlook. Tools like map share tactics have helped me stay ahead.
- Automating isn’t just about efficiency—customization and thoughtful integration make your data more trustworthy. Regular audits of tool configurations, as detailed in this guide, save time and prevent costly misinterpretations.
My Arsenal of Tools for Real Growth
- SEO reporting software: I rely on platforms like SEO reporting software that balance automation with customization, ensuring insights are both timely and tailored to client goals.
- Google Business Analytics: Integrating GBA with other data sources allows for a comprehensive view of customer interactions, from search to store visits, as explained in this resource.
- Maps rank tracking techniques: Advanced methods like local grid analysis and proximity verification, discussed in this article, keep your local SEO strategy sharp.
Believe in the Long Game of Data Mastery
Stepping into the future, embracing evolving tools such as AI-powered analytics and predictive KPIs will distinguish top performers. Regularly updating your methodologies and investing in continuous learning—like exploring cornerstone guides on SEO insights and reporting—ensures your strategies stay relevant and impactful. The key is relentless curiosity and willingness to adapt; progress isn’t a destination but an ongoing journey fueled by insight and intent.
Remember, the most profound growth occurs when you challenge assumptions, dig beneath surface metrics, and refine your tools with purpose. Are you ready to elevate your SEO insights,seo reporting,google business analytics,maps rank tracking,kpi visualization game? Your next leap starts now.