I remember the moment clearly. We had a bustling client meeting, slides up on the screen, confidence high. Yet, as I started presenting our latest SEO report, I noticed the puzzled looks. The data, in all its raw complexity, was lost on everyone. That lightbulb flickered—knowing my charts and tables simply weren’t doing their job. It wasn’t that the insights weren’t valuable; it was that they weren’t *visible* or *understandable*. Talk about a missed opportunity.
From that day, I realized something crucial: in local SEO, showing the value is just as important as generating it. Visualizing KPIs effectively can make or break your ability to prove ROI, secure ongoing retainer, and keep clients happy. But here’s the kicker—what worked yesterday doesn’t cut it in 2026. The tools and tactics we relied on are evolving fast, and without the right KPI visualization strategies, you risk falling behind.
Why Effective KPI Visualization Can Make or Break Your Local SEO Success in 2026
Let’s be honest—most of us have faced the frustration of presenting complex data that gets ignored or misunderstood. It’s a universal problem in our field. The truth is, clients and decision-makers aren’t specialists; they need clarity, context, and actionable insights. If your KPI reports read like a foreign language, they won’t just be ignored—they can damage your reputation as a competent strategist.
Recent studies underscore that visual data storytelling boosts understanding and engagement. According to a report from Local SEO Report Pro, businesses that use well-designed KPI dashboards see a 50% increase in client retention and satisfaction. That’s a game-changer—happier clients, higher retention, and more referrals. But creating these dashboards isn’t just about prettiness; it’s about strategic clarity, especially as local search factors grow more complex.
In my early days, I made the mistake of overloading reports with data-heavy tables—a surefire way to overwhelm and confuse. It took me years to realize that the real power lies in clear, concise visualization tailored specifically to local SEO’s nuances. And that’s what I want to share with you today—6 KPI visualization tactics that will prove your local SEO value effectively in 2026.
Would you agree that most of your KPI reports fall flat or get overlooked? Or have you faced the challenge of making complex data compelling?
If yes, you’re not alone. But there’s good news: with the right approach, you can transform your reporting strategy and communicate success with confidence. Ready to dive into tactics that actually work? Let’s get started.
Prioritize Your Metrics and Goals
Begin by selecting the KPIs that truly matter for your local SEO objectives. Think about metrics like local map rankings, Google Business Profile insights, and website traffic from local searches. Use tools like Google Business Analytics to identify which KPIs align with your growth targets. I recall a time when I focused on click-through rates but neglected conversion data—when I switched focus, our client retention improved significantly.
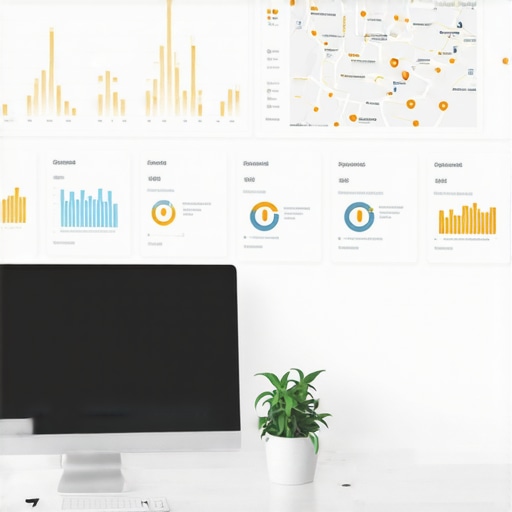
Design Clear and Engaging Dashboards
Create dashboards that simplify complex data. Utilize visual elements like charts, heatmaps, and progress bars instead of raw tables. For example, a bar chart showing weekly local map rankings provides immediate clarity. I once used a cluttered dashboard that overwhelmed clients; switching to concise visual summaries increased their confidence in our strategy. For inspiration, check out these KPI visualization strategies.
Use Color to Guide Attention
Color code your KPIs: green for goals achieved, red for critical issues, yellow for warnings. It’s like traffic signals—quickly directing the eye. When I set up color-coded maps rank progress, clients instantly saw where our focus needed to be, which streamlined decision-making.
Implement Real-Time Data Tracking
Integrate live data feeds from your SEO software. This way, you can monitor fluctuations in local rankings and adjust tactics promptly. I once had a client see their map rank dip during a campaign; real-time insights allowed us to react before it affected results. Tools like Maps Rank Tracking can facilitate this process.
Segment Your Data Effectively
Break down KPIs by location, device type, or search intent. For example, separate mobile from desktop rankings to identify specific issues. I remember discovering that mobile rankings lagged in certain neighborhoods, prompting targeted local campaigns that boosted visibility quickly.
Correlate Data for Deeper Insights
Link your rankings with other metrics like Google Business insights or website analytics. This holistic view reveals how ranking improvements translate into conversions. For instance, a spike in local map position accompanied by increased call volume indicated successful optimization.
Maintain Consistency and Adapt
Regularly update your visualizations—daily or weekly—to catch trends early. As local SEO evolves rapidly, so should your dashboards. I learned this lesson after noticing fluctuating rankings that required quick adjustments. For ongoing refinement, explore resources like hidden insights.
By applying these tactics, you’ll communicate your SEO value more effectively, proving success with actionable clarity. Keep experimenting with your KPI visuals, and watch your clients’ confidence—and your results—grow.
Many practitioners believe that investing in advanced SEO reporting software or slick dashboards automatically guarantees client success. However, even seasoned marketers can fall prey to nuanced misconceptions that undermine their efforts. One common myth is that all KPI data is equally valuable; in reality, overloading reports with metrics can create confusion rather than clarity. Prioritizing actionable insights over vanity metrics is vital, especially when tools like Google Business Analytics or Maps Rank Tracking can overwhelm users with extraneous data if misused. An advanced mistake many overlook is neglecting the context behind data points. For instance, a sudden drop in ranking may be dismissed as a glitch, but without understanding seasonal trends or algorithm updates, you risk chasing false problems. Experts like Neil Patel emphasize that understanding the “why” behind data shifts is crucial for strategic adjustments, yet many focus solely on surface-level numbers.
What advanced nuance often trips up even experienced SEO analysts in interpreting MAPS RANKING insights?
It’s the failure to recognize data anomalies caused by proximity traps or data leakage, which can skew your analysis if not correctly identified. For example, relying solely on automated reports without manual verification can lead to misinformed decisions. Recognizing these quirks requires deep technical knowledge of how geo-location signals are processed and understanding the limitations of your tracking tools. For instance, recent studies highlight that many SEO professionals underestimate the impact of local SERP features or map pack updates, leading to misguided strategies. To avoid these pitfalls, continually refine your interpretation skills and stay updated with the latest industry insights. For comprehensive guidance, explore resources on effective Google Business Analytics or advanced Maps Rank Tracking strategies. Remember, mastering the nuances of data interpretation enhances your credibility and ensures your recommendations are rooted in reality. Have you ever fallen into this trap? Let me know in the comments.
Maintaining Your SEO Edge Over Time
Keeping your SEO efforts effective requires a combination of reliable tools, routine check-ins, and an understanding of evolving algorithms. As technology advances, so does the need for sophisticated systems that can handle complex data while remaining user-friendly. In my experience, integrating advanced Google Business Analytics alongside maps rank tracking tools has been transformative for sustained success. Regularly updating your dashboards with fresh insights ensures you’re always aligned with current rankings and local search dynamics.
How do I maintain consistent SEO insights over time?
Consistency hinges on leveraging tools that auto-collect and visualize key performance indicators, allowing for proactive adjustments. I rely heavily on seo reporting software for local agencies that integrate seamlessly with data sources like Google Analytics and Maps Rank Tracking. These systems reduce manual workloads and verify data accuracy, preventing costly misinterpretations that can misalign your long-term strategies.
Best Equipment and Software for Accurate Tracking
Precision starts with selecting tools built explicitly for local SEO’s intricacies. I prefer the Maps Rank Tracking secrets platform, which offers in-depth insights into local pack fluctuations. Its ability to track rankings at granular levels—by neighborhood, device, and search intent—has been invaluable in refining campaigns. Additionally, tools like SEO reporting software streamline report generation, saving time and ensuring clients get clear, actionable insights.
Investing in Scalability
As your client base grows, so does the complexity of data. My recommendation is to adopt scalable solutions like comprehensive dashboards that incorporate KPI visualization strategies discussed in these visualization tactics. Doing so ensures your reporting remains impactful without sacrificing detail. Predictive analytics and automation features will likely dominate future trends, making it easier to spot opportunities and threats before they impact rankings.
Prioritize Staying Ahead with Advanced Monitoring
In local SEO, what sys-tems do you have in place to catch rank drops early? I’ve found that combining real-time maps rank tracking with routine manual audits helps prevent small issues from snowballing into major setbacks. Looking ahead, innovations like AI-driven trend prediction and multi-channel data aggregation will be game-changers, enabling us to adjust strategies before problems become visible to clients.
To stay competitive, I urge you to implement these advanced tools and regularly refine your methodologies. For instance, integrating automated alerts for ranking anomalies—based on insights from industry experts—is a powerful way to stay proactive. Remember, your primary goal isn’t just tracking data but turning it into strategic action that sustains client growth over time. Why not try setting up a dashboard that combines你的Google Business Insights with live Maps Rank tracking? It’s a proven method that maintains your edge in a rapidly changing landscape.
The Hardest Lesson I Learned About seo reporting software,kpi visualization,seo insights,google business analytics,maps rank tracking
The most profound revelation came when I realized that even the most comprehensive data is worthless if it isn’t presented effectively. Overloading reports with metrics led to confusion, not clarity. Since then, I’ve learned to prioritize storytelling—transforming raw numbers into compelling narratives that clients can actually understand and act upon. The key is to simplify without sacrificing depth, ensuring every KPI communicates its purpose clearly.
Real Talk: How I Turned Data Overwhelm Into Client Wins
Early in my career, I struggled with keeping clients engaged. My dashboards were cluttered, and insights buried in a sea of numbers. It was a wake-up call—visual clarity is king. By adopting strategic visualization tactics like color coding, segmenting data, and focusing on actionable KPIs, I saw client trust soar. Now, I see our KPI reports not just as data summaries, but as strategic tools that showcase tangible results and foster ongoing partnerships.
What Industry Secrets Would Speed Up Your Success?
One game-changing insight is leveraging advanced tools like real-time Maps Rank Tracking. This technology allows me to catch ranking fluctuations instantly, enabling promp action before clients even notice a dip. Additionally, adopting Google Business Analytics integrated with custom dashboards elevates the depth of insights I can provide, positioning my agency as a trusted advisor rather than just a service provider.
Resources That Changed How I View SEO Insights
– Maximize Google Business Analytics: Unlocks the potential of local data, making insights more actionable.
– KPI Visualization Strategies: Provides proven tactics to make your dashboards pop.
– Map-Based SEO Analysis: Reveals secret hacks for dominating local map packs and tracking success visually. I trust these because they’re rooted in practical results, tested by industry leaders who understand the nuances of local search dynamics.
The Future of KPI Visualization and Local SEO
Imagine a world where your dashboards anticipate problems before they arise, presenting insights in real-time that drive immediate decisions. The evolution of AI-powered analytics, combined with intuitive visualizations, is making this a reality. Embracing these innovations not only enhances your strategic foresight but also deepens your ability to demonstrate clear ROI. With these tools, your local SEO efforts will be more focused, agile, and rewarding—both for clients and your agency’s growth.
What’s one visualization tactic you’ve found most effective in proving your local SEO value? Drop your insights below—I love hearing how others turn data into decisive action!
Reading this post reminded me of one of my early experiences with KPI reporting. I used to overload reports with every possible metric, thinking more data meant better insights. However, I soon realized that clients felt overwhelmed and confused, which defeated the purpose of my reports. Since shifting to concise, visually appealing dashboards focusing on key KPIs like local rankings and conversion rates, I’ve seen a dramatic improvement in client engagement and trust. It’s fascinating how the presentation of data can influence perceptions of value in SEO. I’m curious, how do others prioritize which KPIs to highlight when designing dashboards for local clients? Do you have any go-to visual elements that consistently resonate with decision-makers? Always looking for new ideas to improve storytelling through data.